Multiple Choice
Figure 12.7 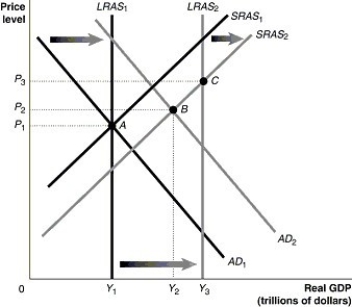 Alt text for Figure 12.7: In figure 12.7, a graph comparing real GDP and price level.
Long description for Figure 12.7: The x-axis is labelled, real GDP (trillions of dollars) , with points Y1, Y2, and Y3 marked.The y-axis is labelled, price level, with points P1, P2, and P3 marked.6 lines are shown; SRAS1, SRAS2, AD1, AD2, LRAS1, and LRAS2.Line SRAS1 begins in the bottom left corner and slopes up to the top right corner.Line SRAS2 follows the same slope as line SRAS1, but is plotted to the right.The space between lines SRAS1 and SRAS2 is indicated by a right pointing arrow.Line AD1 begins at the top left corner and slopes down to the bottom center.Line AD2 follows the same slope as line AD1, but is plotted to the right.The area between lines AD1 and AD2 is indicated by a right pointing arrow.Line LRAS1 is perpendicular to the x-axis, and begins from the x-axis value Y1.Line LRAS2 is perpendicular to the x-axis, and begins from the x-axis value Y3.The are between lines LRAS1 and LRAS2 is indicated by a right pointing arrow.Line LRAS1 intersects lines AD1 and SRAS1 at point A (Y1, P1) .Lines AD2 and SRAS2 intersect at point B (Y2, P2) .Line LRAS2 intersects line SRAS2 at point C (Y3, P3) .Points A, B, and C are connected to their respective coordinates on the x and y-axis with dotted lines.
-Refer to Figure 12.7.Given that the economy has moved from A to B in the graph above, which of the following would be the appropriate fiscal policy to achieve potential GDP?
A) increase taxes
B) increase government spending
C) contractionary fiscal policy
D) decrease interest rates
E) increase the exchange rate
Correct Answer:

Verified
Correct Answer:
Verified
Q1: In the last 5 years, government spending
Q2: Figure 12.1 <img src="https://d2lvgg3v3hfg70.cloudfront.net/TB3061/.jpg" alt="Figure 12.1
Q3: Suppose real GDP is $1.7 trillion and
Q4: Figure 12.6 <img src="https://d2lvgg3v3hfg70.cloudfront.net/TB3061/.jpg" alt="Figure 12.6
Q7: The increase in government spending on Employment
Q9: From an initial long-run equilibrium, if aggregate
Q10: Figure 12.6 <img src="https://d2lvgg3v3hfg70.cloudfront.net/TB3061/.jpg" alt="Figure 12.6
Q11: The automatic budget surpluses and budget deficits
Q39: The government purchases multiplier will be larger
Q158: Suppose Political Party A proposes a tax