Multiple Choice
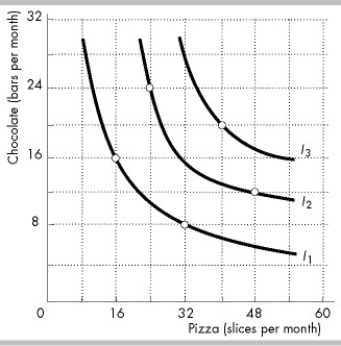
-The indifference curves in the figure above (I1, I2, and I3) reflect Peter's consumption preferences. Which of the following combinations of goods does Peter prefer the most?
A) 48 slices of pizza and 12 chocolate bars
B) 24 slices of pizza and 24 chocolate bars
C) 40 slices of pizza and 20 chocolate bars
D) 32 slices of pizza and 8 chocolate bars
Correct Answer:

Verified
Correct Answer:
Verified
Q181: Janelle spends all of her income on
Q182: <img src="https://d2lvgg3v3hfg70.cloudfront.net/TB5274/.jpg" alt=" -In the table
Q183: Why is the budget line negatively sloped?
Q184: Nick considers macaroni and cheese to be
Q185: <img src="https://d2lvgg3v3hfg70.cloudfront.net/TB5274/.jpg" alt=" -The income effect
Q187: Which of the following is NOT a
Q188: <img src="https://d2lvgg3v3hfg70.cloudfront.net/TB5274/.jpg" alt=" -In the above
Q189: Jake spends $200 on fried chickens and
Q190: The _ effect can be divided into
Q191: <img src="https://d2lvgg3v3hfg70.cloudfront.net/TB5274/.jpg" alt=" -In the figure