Multiple Choice
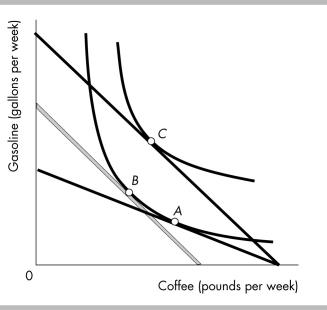
-The income effect from a fall in the price of a gallon of gasoline is shown in the above figure by the movement from
A) point A to point C.
B) point A to point B.
C) point B to point C.
D) point A to point B and then to point C.
Correct Answer:

Verified
Correct Answer:
Verified
Q180: <img src="https://d2lvgg3v3hfg70.cloudfront.net/TB5274/.jpg" alt=" -The above figure
Q181: Janelle spends all of her income on
Q182: <img src="https://d2lvgg3v3hfg70.cloudfront.net/TB5274/.jpg" alt=" -In the table
Q183: Why is the budget line negatively sloped?
Q184: Nick considers macaroni and cheese to be
Q186: <img src="https://d2lvgg3v3hfg70.cloudfront.net/TB5274/.jpg" alt=" -The indifference curves
Q187: Which of the following is NOT a
Q188: <img src="https://d2lvgg3v3hfg70.cloudfront.net/TB5274/.jpg" alt=" -In the above
Q189: Jake spends $200 on fried chickens and
Q190: The _ effect can be divided into