Multiple Choice
Figure 16-4 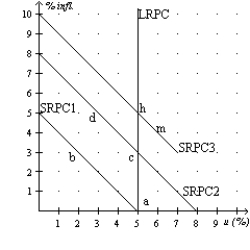
-Refer to Figure 16-4. Along SRPC1, what is the expected rate of inflation?
A) 0 percent
B) 2 percent
C) 5 percent
D) 8 percent
Correct Answer:

Verified
Correct Answer:
Verified
Related Questions
Q6: Why does a downward-sloping Phillips curve imply
Q30: The vertical long-run Phillips curve is an
Q76: How will an adverse supply shock shift
Q130: Which of the following best characterizes the
Q131: Which of the following would cause the
Q132: Scenario 2<br>Suppose the natural rate of unemployment
Q135: What did Samuelson and Solow believe about
Q136: Figure 16-4 <img src="https://d2lvgg3v3hfg70.cloudfront.net/TB4795/.jpg" alt="Figure 16-4
Q137: Scenario 2<br>Suppose the natural rate of unemployment
Q138: In 1980, what was the Canadian inflation