Multiple Choice
Figure 16-4 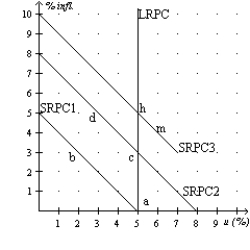
-Refer to Figure 16-4. At point b, how do actual and expected inflation rates and unemployment rates compare?
A) The actual inflation rate is less than the expected inflation rate, and the actual rate of unemployment exceeds the natural rate of unemployment.
B) The actual inflation rate is greater than the expected inflation rate, and the actual rate of unemployment exceeds the natural rate of unemployment.
C) The actual inflation rate is less than the expected inflation rate, and the actual rate of unemployment is less than the natural rate of unemployment.
D) The actual inflation rate is greater than the expected inflation rate, and the actual rate of unemployment is less than the natural rate of unemployment.
Correct Answer:

Verified
Correct Answer:
Verified
Q6: Why does a downward-sloping Phillips curve imply
Q131: Which of the following would cause the
Q132: Scenario 2<br>Suppose the natural rate of unemployment
Q133: Figure 16-4 <img src="https://d2lvgg3v3hfg70.cloudfront.net/TB4795/.jpg" alt="Figure 16-4
Q134: A decrease in expected inflation shifts which
Q135: What did Samuelson and Solow believe about
Q137: Scenario 2<br>Suppose the natural rate of unemployment
Q138: In 1980, what was the Canadian inflation
Q140: Suppose that the money supply increases. In
Q141: Suppose the Bank of Canada reduces inflation