Multiple Choice
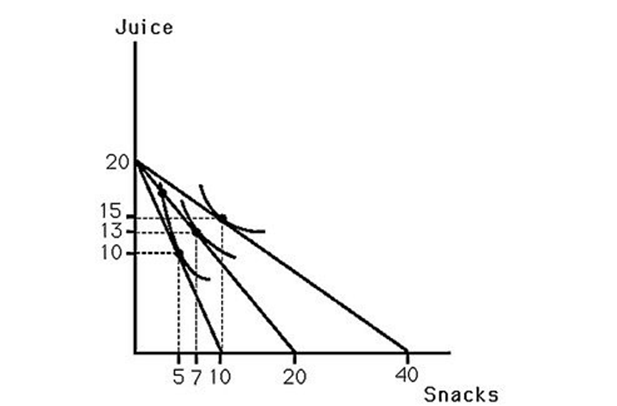
-The above figure shows Bobby's indifference map for juice and snacks.Also shown are three budget lines resulting from different prices for snacks.This information could be used to determine
A) the slope of Bobby's demand curve for juice.
B) the amount by which Bobby's demand curve for juice shifts when his income rises.
C) the amount by which Bobby's demand curve for juice shifts when the price of snacks rises.
D) All of the above.
Correct Answer:

Verified
Correct Answer:
Verified
Q102: When deriving an Engel curve,the prices of
Q103: After Joyce and Larry purchased their first
Q104: Wealthy people will tend to have vertical
Q105: The substitution effect can be measured holding
Q106: Draw a graph with Goods Per Day
Q108: In response to an increase in the
Q109: Due to inflation,nominal prices are usually<br>A) equal
Q110: <img src="https://d2lvgg3v3hfg70.cloudfront.net/TB6808/.jpg" alt=" -In the above
Q111: A true cost-of-living adjustment (COLA)in response to
Q112: <img src="https://d2lvgg3v3hfg70.cloudfront.net/TB6808/.jpg" alt=" -The above figure