Multiple Choice
Graph 5-4
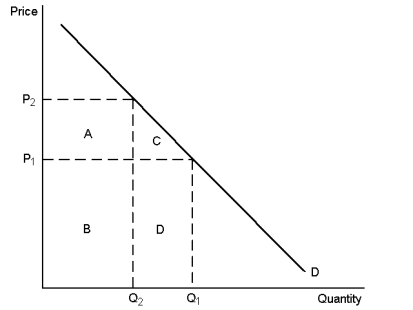
-Refer to Graph 5-4. Total revenue at P2 would be represented by area(s) :
A) B + D
B) A + B
C) C + D
D) D
Correct Answer:

Verified
Correct Answer:
Verified
Related Questions
Q44: If price changes and total revenue changes
Q62: The discovery of a new hybrid wheat
Q66: You have just been hired by a
Q80: When demand is elastic in the current
Q120: Alice says that she would buy one
Q121: Demand is classed as elastic if the
Q128: Use the graphs below to answer the
Q139: The price elasticity of demand for a
Q150: The demand for a good is said
Q172: Graph 5-2 <img src="https://d2lvgg3v3hfg70.cloudfront.net/TB8859/.jpg" alt="Graph 5-2