Essay
Use the graphs below to answer the following questions.
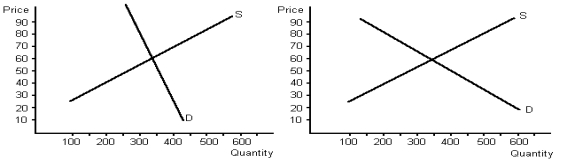 a. Determine equilibrium price and quantity for each graph.
b. Given demand and supply, what would total revenue be for each graph?
c. Assume that supply shifts to the left on both graphs by 100, raising price. Given the new equilibrium price and equilibrium quantity, what would total revenue be for each graph?
d. What do your answers to part c tell you about the relationship between elasticity of demand and total revenue?
Correct Answer:

Verified
a. The equilibrium price would be $60 an...View Answer
Unlock this answer now
Get Access to more Verified Answers free of charge
Correct Answer:
Verified
View Answer
Unlock this answer now
Get Access to more Verified Answers free of charge
Q44: If price changes and total revenue changes
Q62: The discovery of a new hybrid wheat
Q66: You have just been hired by a
Q80: When demand is elastic in the current
Q108: Suppose you are the manager of a
Q121: The price elasticity of demand measures how
Q125: Graph 5-4<br> <img src="https://d2lvgg3v3hfg70.cloudfront.net/TB3776/.jpg" alt="Graph 5-4
Q139: The price elasticity of demand for a
Q150: The demand for a good is said
Q175: The concept of elasticity is used to:<br>A)analyse