Multiple Choice
Consider the following chart.Which of the following statements is most correct? 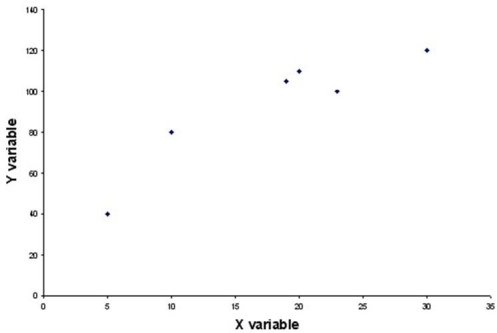
A) There is a negative linear relationship between the two variables.
B) There is a positive linear relationship between the two variables.
C) There is a perfect linear relationship between the two variables.
D) There is no apparent relationship between the two variables.
Correct Answer:

Verified
Correct Answer:
Verified
Q17: Discuss the steps that you would use
Q25: When developing a frequency distribution,the following classes
Q26: The undergraduate students at your university are
Q26: Consider the following chart.Which of the following
Q55: Roscoe and Associates makes computer software for
Q83: A line chart is most appropriate for:<br>A)
Q84: A university recently collected data for a
Q99: For the same data, a graph of
Q113: If you have constructed a joint frequency
Q119: The following class limits would be acceptable