Multiple Choice
Consider the following chart.Which of the following statements is most correct? 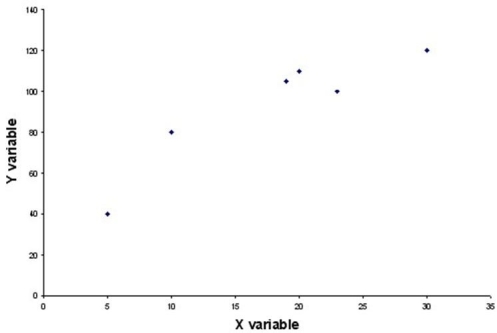
A) The values for the dependent variable are determined by the values for the independent variable.
B) The values in a scatter plot should be connected by a straight line.
C) The variable on the horizontal axis should be the independent variable.
D) A scatter plot like this one shows the trend in the data over time.
Correct Answer:

Verified
Correct Answer:
Verified
Q17: Discuss the steps that you would use
Q23: Consider the following chart.Which of the following
Q25: When developing a frequency distribution,the following classes
Q26: The undergraduate students at your university are
Q71: The upper and lower limits of each
Q84: A university recently collected data for a
Q99: For the same data, a graph of
Q108: A homeowners association consists of 20 homes.
Q119: The following class limits would be acceptable
Q125: Frequency distributions can be formed from which