Multiple Choice
Figure 5-1 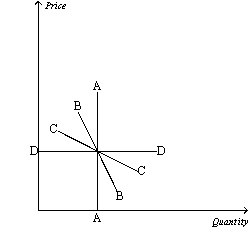
-Refer to Figure 5-1.The demand curve representing the demand for a luxury good with several close substitutes is
A) A.
B) B.
C) C.
D) D.
Correct Answer:

Verified
Correct Answer:
Verified
Related Questions
Q33: Which of the following should be held
Q73: Assume that a 4 percent increase in
Q74: Figure 5-13 <img src="https://d2lvgg3v3hfg70.cloudfront.net/TB4796/.jpg" alt="Figure 5-13
Q75: If a 30 percent change in price
Q78: Figure 5-6 <img src="https://d2lvgg3v3hfg70.cloudfront.net/TB4796/.jpg" alt="Figure 5-6
Q79: Table 5-2<br>The following table shows a portion
Q79: When small changes in price lead to
Q81: Figure 5-14 <img src="https://d2lvgg3v3hfg70.cloudfront.net/TB4796/.jpg" alt="Figure 5-14
Q82: At a price of $1.00,a local coffee
Q276: If the price elasticity of demand for