Multiple Choice
Figure 5-13 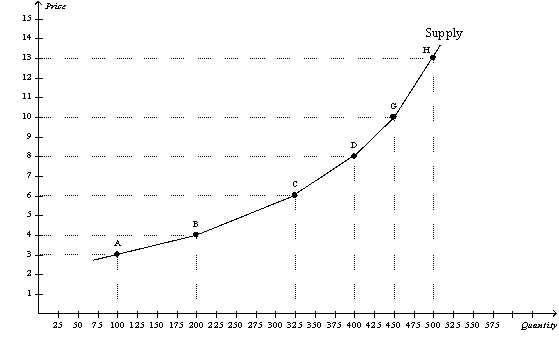
-Refer to Figure 5-13.Using the midpoint method,what is the price elasticity of supply between points B and C?
A) 1.67
B) 1.19
C) 0.84
D) 0.61
Correct Answer:

Verified
Correct Answer:
Verified
Q33: Which of the following should be held
Q73: Assume that a 4 percent increase in
Q75: If a 30 percent change in price
Q77: Figure 5-1 <img src="https://d2lvgg3v3hfg70.cloudfront.net/TB4796/.jpg" alt="Figure 5-1
Q78: Figure 5-6 <img src="https://d2lvgg3v3hfg70.cloudfront.net/TB4796/.jpg" alt="Figure 5-6
Q79: Table 5-2<br>The following table shows a portion
Q152: Suppose goods A and B are substitutes
Q181: Figure 5-2 <img src="https://d2lvgg3v3hfg70.cloudfront.net/TB2297/.jpg" alt="Figure 5-2
Q276: If the price elasticity of demand for
Q319: Table 5-3<br>The following table shows the demand