Multiple Choice
Figure 21-8 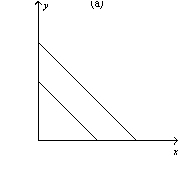
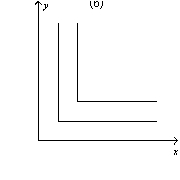
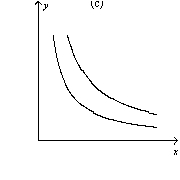
-Refer to Figure 21-8.Which of the graphs shown may represent indifference curves?
A) graph a
B) graph b
C) graph c
D) All of the above are correct.
Correct Answer:

Verified
Correct Answer:
Verified
Q3: Explain the relationship between the budget constraint
Q109: The following diagram shows two budget lines:
Q110: Figure 21-11 <img src="https://d2lvgg3v3hfg70.cloudfront.net/TB4796/.jpg" alt="Figure 21-11
Q111: Which of the following does not represent
Q114: A consumer has preferences over two goods,X
Q115: Figure 21-11 <img src="https://d2lvgg3v3hfg70.cloudfront.net/TB4796/.jpg" alt="Figure 21-11
Q118: Figure 21-7 <img src="https://d2lvgg3v3hfg70.cloudfront.net/TB4796/.jpg" alt="Figure 21-7
Q437: Suppose a consumer has an income of
Q442: If we observe that a consumer's budget
Q554: Assume that a consumer's indifference curve is