Multiple Choice
Figure 21-11 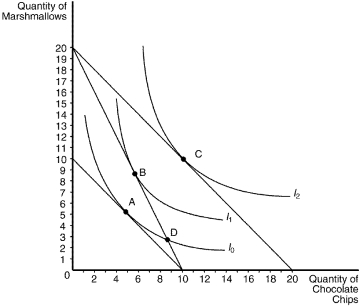
-Refer to Figure 21-11.Assume that the consumer depicted in the figure has an income of $40.Based on the information available in the graph,which of the following price-quantity combinations would be on her demand curve for marshmallows if the price of chocolate chips is $4?
A) P=$2,Q=3
B) P=$2,Q=9
C) P=$4,Q=3
D) P=$4,Q=9
Correct Answer:

Verified
Correct Answer:
Verified
Q3: Explain the relationship between the budget constraint
Q43: Explain the difference between inferior and normal
Q109: The following diagram shows two budget lines:
Q111: Which of the following does not represent
Q113: Figure 21-8 <img src="https://d2lvgg3v3hfg70.cloudfront.net/TB4796/.jpg" alt="Figure 21-8
Q114: A consumer has preferences over two goods,X
Q115: Figure 21-11 <img src="https://d2lvgg3v3hfg70.cloudfront.net/TB4796/.jpg" alt="Figure 21-11
Q201: A family on a trip budgets $800
Q208: Bundle A contains 10 units of good
Q437: Suppose a consumer has an income of