Multiple Choice
Figure 16-3 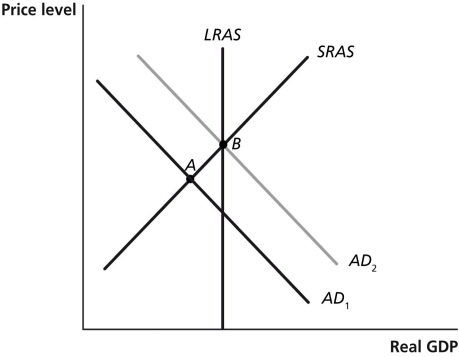
-Refer to Figure 16-3.In the graph above,suppose the economy is initially at point A.The movement of the economy to point B as shown in the graph illustrates the effect of which of the following policy actions by Congress and the president?
A) a decrease in income taxes
B) a decrease in interest rates
C) a decrease in government purchases
D) an increase in the money supply
Correct Answer:

Verified
Correct Answer:
Verified
Q90: The income tax system serves as an
Q91: The aggregate demand curve will shift to
Q92: Suppose real GDP is currently $12.5 trillion
Q93: Which of the following is a reason
Q94: Explain why the tax multiplier is different
Q96: A decrease in the tax rate will
Q97: What is meant by crowding out? Explain
Q98: The tax wedge is the difference between
Q99: The tax multiplier is calculated as "one
Q100: Figure 16-5 <img src="https://d2lvgg3v3hfg70.cloudfront.net/TB1236/.jpg" alt="Figure 16-5