Multiple Choice
Figure 16-5 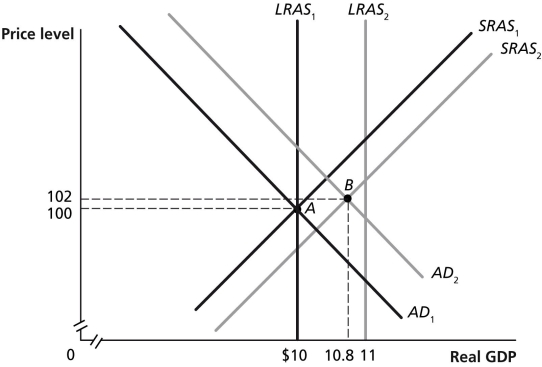
-Refer to Figure 16-5.In the dynamic model of AD-AS in the figure above,if the economy is at point A in year 1 and is expected to go to point B in year 2,Congress and the president would most likely
A) decrease government spending.
B) increase government spending.
C) increase oil prices.
D) increase taxes.
E) lower interest rates.
Correct Answer:

Verified
Correct Answer:
Verified
Q95: Figure 16-3 <img src="https://d2lvgg3v3hfg70.cloudfront.net/TB1236/.jpg" alt="Figure 16-3
Q96: A decrease in the tax rate will
Q97: What is meant by crowding out? Explain
Q98: The tax wedge is the difference between
Q99: The tax multiplier is calculated as "one
Q101: In an open economy,the government purchases multiplier
Q102: Figure 16-6 <img src="https://d2lvgg3v3hfg70.cloudfront.net/TB1236/.jpg" alt="Figure 16-6
Q103: Does expansionary fiscal policy directly increase the
Q104: Suppose real GDP is $12.1 trillion and
Q105: Federal government purchases as a percentage of