Multiple Choice
Figure 19-12 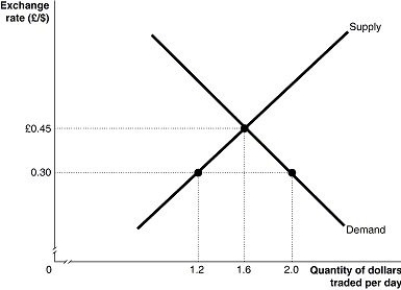
-Refer to Figure 19-12.The graph above,depicts supply and demand for U.S.dollars during a trading day.At a fixed exchange rate of 0.30 pounds per dollar,the dollar is ________ versus the pound.A ________ of the dollar would correct the fundamental disequilibrium that exists in this market.
A) undervalued; devaluation
B) undervalued; revaluation
C) overvalued; revaluation
D) overvalued; devaluation
Correct Answer:

Verified
Correct Answer:
Verified
Q246: If currencies around the world are based
Q247: A Big Mac costs $4.00 in the
Q248: You decide to work in London for
Q249: In order to reduce or eliminate a
Q250: Under which exchange rate system was a
Q251: What do reports that the dollar is
Q252: The "Big Mac Theory of Exchange Rates"
Q253: From the beginning of 1973 until June
Q254: If the exchange rate between the U.S.dollar
Q255: A decrease in a fixed exchange rate