Multiple Choice
The figure shows a pV diagram for 0.98 mol of ideal gas that undergoes the process 1 → 2.The gas then undergoes an isochoric heating from point 2 until the pressure is restored to the value it had at point 1.What is the final temperature of the gas? (R = 8.31 J/mol ∙ K) . 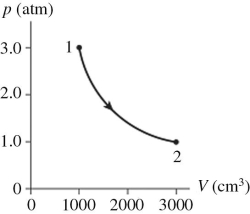
A) -160°C
B) 12°C
C) 380°C
D) 110°C
Correct Answer:

Verified
Correct Answer:
Verified
Q51: For an ideal gas,<br>A)C<sub>P</sub> = C<sub>V</sub> for
Q52: The figure shows a pV diagram for
Q53: The gas in a perfectly insulated but
Q54: The ocean thermal energy conversion project uses
Q55: An ideal gas is compressed isothermally to
Q57: A certain ideal gas has a molar
Q58: An air conditioner with a coefficient of
Q59: If the efficiency of a Carnot engine
Q60: The temperature of an ideal gas in
Q61: An ideal Carnot engine is operated as