Multiple Choice
For the graph shown in the figure,what physical quantity does the slope of the graph represent for ohmic material? 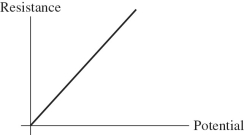
A) current
B) resistivity
C) 1/(current)
D) power
E) 1/(resistivity)
Correct Answer:

Verified
Correct Answer:
Verified
Related Questions
Q45: As more resistors are added in parallel
Q46: The length of a certain wire is
Q47: Three resistors with resistances of 2.0 Ω,6.0
Q48: Determine the current in the 4.0-Ω resistor
Q49: Three light bulbs,A,B,and C,have electrical ratings as
Q51: An ideal 100-V dc battery is applied
Q52: The figure shows a graph of the
Q53: For the graph shown in the figure,what
Q54: Determine the current in the 12-Ω resistor
Q55: What is the resistance of a 0.100-kW