Multiple Choice
The figure shows a graph of the resistance of a wire as a function of its length.What physical quantities does the slope of this graph represent? 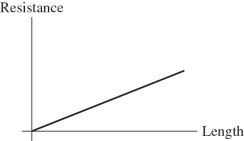
A) the cross-sectional area of the wire
B) the resistivity of the material of which the wire is made
C) the product of the resistivity and the cross-sectional area of the wire
D) the resistivity of the material divided by the cross-sectional area of the wire
E) the reciprocal of the resistivity of the material
Correct Answer:

Verified
Correct Answer:
Verified
Q47: Three resistors with resistances of 2.0 Ω,6.0
Q48: Determine the current in the 4.0-Ω resistor
Q49: Three light bulbs,A,B,and C,have electrical ratings as
Q50: For the graph shown in the figure,what
Q51: An ideal 100-V dc battery is applied
Q53: For the graph shown in the figure,what
Q54: Determine the current in the 12-Ω resistor
Q55: What is the resistance of a 0.100-kW
Q56: The length of a certain wire is
Q57: A metal bar is 20 cm long