Essay
Table 3.1 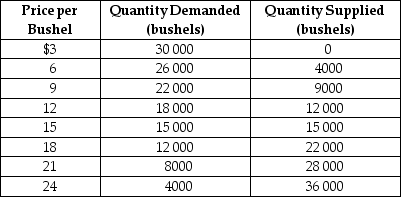
-Refer to Table 3.1.The table contains information about the corn market.Use the table to answer the following questions.
a. What are the equilibrium price and quantity of corn?
b.Suppose the prevailing price is $9 per bushel.Is there a shortage or a surplus in the market?
c.What is the quantity of the shortage or surplus?
d.How many bushels will be sold if the market price is $9 per bushel?
e.If the market price is $9 per bushel, what must happen to restore equilibrium in the market?
f.At what price will suppliers be able to sell 22 000 bushels of corn?
g.Suppose the market price is $21 per bushel.Is there a shortage or a surplus in the market?
h.What is the quantity of the shortage or surplus?
i.How many bushels will be sold if the market price is $21 per bushel?
j.If the market price is $21 per bushel, what must happen to restore equilibrium in the market?
_____________________________________________________________________________________________
_____________________________________________________________________________________________
Correct Answer:

Verified
Correct Answer:
Verified
Q7: Draw a demand curve and label it
Q8: Figure 3.8 <img src="https://d2lvgg3v3hfg70.cloudfront.net/TB1015/.jpg" alt="Figure 3.8
Q10: Figure 3.8 <img src="https://d2lvgg3v3hfg70.cloudfront.net/TB1015/.jpg" alt="Figure 3.8
Q30: Indicate whether each of the following situations
Q54: Last year, the Pottery Palace supplied 8,000
Q68: If the demand for a product decreases
Q78: From a supply perspective, what impact would
Q118: Assume that both the demand curve and
Q121: Figure 3-5<br> <img src="https://d2lvgg3v3hfg70.cloudfront.net/TB4193/.jpg" alt="Figure 3-5
Q150: An increase in the demand for lobster