Multiple Choice
Figure 3.7 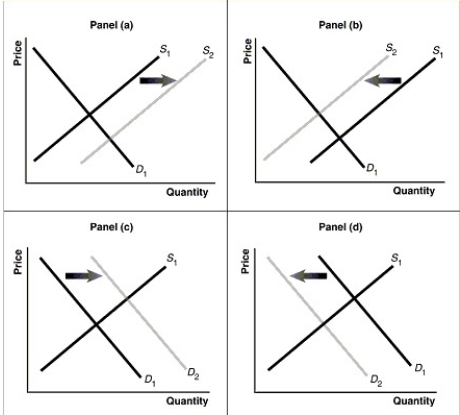
-Refer to Figure 3.7.Assume that the graphs in this figure represent the demand and supply curves for used movie tickets, an inferior good.Which panel describes what happens in this market as a result of a decrease in income?
A) Panel (a)
B) Panel (b)
C) Panel (c)
D) Panel (d)
Correct Answer:

Verified
Correct Answer:
Verified
Q44: In June, buyers of titanium expect that
Q119: Figure 3-4<br> <img src="https://d2lvgg3v3hfg70.cloudfront.net/TB4193/.jpg" alt="Figure 3-4
Q145: A change in supply is represented by
Q178: Which of the following statements is true?<br>A)An
Q198: The cost of raising beef cattle has
Q214: In January, buyers of gold expect that
Q233: Figure 3-7<br> <img src="https://d2lvgg3v3hfg70.cloudfront.net/TB4193/.jpg" alt="Figure 3-7
Q249: Let D = demand, S = supply,
Q336: Figure 3-1 <img src="https://d2lvgg3v3hfg70.cloudfront.net/TB7397/.jpg" alt="Figure 3-1
Q472: Figure 3-1 <img src="https://d2lvgg3v3hfg70.cloudfront.net/TB7397/.jpg" alt="Figure 3-1