Multiple Choice
Figure 5.1 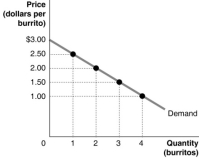 Figure 5.1 shows Arnold's demand curve for burritos.
-Refer to Figure 5.1.What is Arnold's marginal benefit from consuming the third burrito?
A) $1.25.
B) $1.50.
C) $2.50.
D) $6.00.
Correct Answer:

Verified
Correct Answer:
Verified
Q14: What is "tax incidence"? What determines tax
Q59: One result of a tax is an
Q128: Table 5.3 <img src="https://d2lvgg3v3hfg70.cloudfront.net/TB1015/.jpg" alt="Table 5.3
Q129: Figure 5.7 <img src="https://d2lvgg3v3hfg70.cloudfront.net/TB1015/.jpg" alt="Figure 5.7
Q131: If the market price is at equilibrium,
Q133: Arthur buys a new mobile phone for
Q134: The graph below represents the market for
Q135: Economic efficiency is a market outcome in
Q136: A minimum wage law dictates<br>A)the minimum quantity
Q142: The difference between the _ and the