Essay
The graph below represents the market for lychee nuts.The equilibrium price is $7.00 per bushel, but the market price is $5.00 per bushel.Identify the areas representing consumer surplus, producer surplus, and deadweight loss at the equilibrium price of $7.00 and at the market price of $5.00. 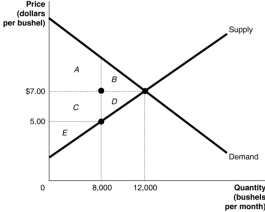 __________________________________________________________________________________________________________________________________________________________________________________________
Correct Answer:

Verified
At the equilibrium price of $7.00:
Consu...View Answer
Unlock this answer now
Get Access to more Verified Answers free of charge
Correct Answer:
Verified
Consu...
View Answer
Unlock this answer now
Get Access to more Verified Answers free of charge
Q14: What is "tax incidence"? What determines tax
Q59: One result of a tax is an
Q83: Marginal benefit is the total benefit to
Q129: Figure 5.7 <img src="https://d2lvgg3v3hfg70.cloudfront.net/TB1015/.jpg" alt="Figure 5.7
Q131: If the market price is at equilibrium,
Q132: Figure 5.1 <img src="https://d2lvgg3v3hfg70.cloudfront.net/TB1015/.jpg" alt="Figure 5.1
Q133: Arthur buys a new mobile phone for
Q135: Economic efficiency is a market outcome in
Q136: A minimum wage law dictates<br>A)the minimum quantity
Q138: Table 5.4 <img src="https://d2lvgg3v3hfg70.cloudfront.net/TB1015/.jpg" alt="Table 5.4