Multiple Choice
Figure 7.2 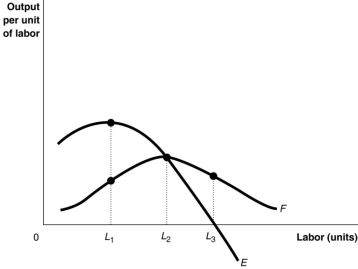
-Refer to Figure 7.2.The curve labelled 'F' is
A) the total product curve.
B) the average product curve.
C) the marginal product curve.
D) the output supply curve.
Correct Answer:

Verified
Correct Answer:
Verified
Q51: One reason why, in the short run,
Q52: Table 7.1 <img src="https://d2lvgg3v3hfg70.cloudfront.net/TB1015/.jpg" alt="Table 7.1
Q54: Table 7.3 <img src="https://d2lvgg3v3hfg70.cloudfront.net/TB1015/.jpg" alt="Table 7.3
Q57: What is true at the minimum efficient
Q58: How do economic costs of production differ
Q60: Figure 7.6 <img src="https://d2lvgg3v3hfg70.cloudfront.net/TB1015/.jpg" alt="Figure 7.6
Q172: If marginal cost is above the average
Q199: Average total cost is equal to average
Q282: The slope of an isocost line determines
Q295: On an isoquant/isocost graph, the least cost