Multiple Choice
Figure 7.6 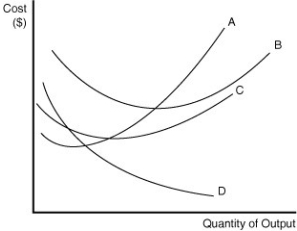 Figure 7.6 contains information about the short-run cost structure of a firm.
-Refer to Figure 7.6.In the figure above, which letter represents the average variable cost curve?
A) A
B) B
C) C
D) D
Correct Answer:

Verified
Correct Answer:
Verified
Q55: Figure 7.2 <img src="https://d2lvgg3v3hfg70.cloudfront.net/TB1015/.jpg" alt="Figure 7.2
Q57: What is true at the minimum efficient
Q58: How do economic costs of production differ
Q62: A curve that shows all the combinations
Q63: What are the processes called that a
Q64: Table 7.3 <img src="https://d2lvgg3v3hfg70.cloudfront.net/TB1015/.jpg" alt="Table 7.3
Q65: Table 7.5 <img src="https://d2lvgg3v3hfg70.cloudfront.net/TB1015/.jpg" alt="Table 7.5
Q199: Average total cost is equal to average
Q207: In the long run, all of a
Q282: The slope of an isocost line determines