Multiple Choice
Figure 10.4 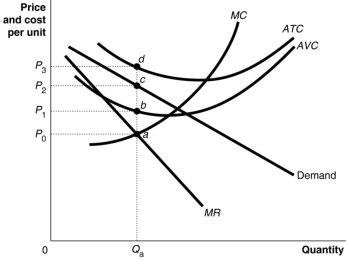 Figure 10.4 shows short-run cost and demand curves for a monopolistically competitive firm in the market for designer watches.
-Refer to Figure 10.4.The area that represents the loss made by the firm is
A) the area P0adP3
B) the area P1bcP2
C) the area P0acP2
D) the area P2cdP3
Correct Answer:

Verified
Correct Answer:
Verified
Q10: Long-run equilibrium under monopolistic competition is similar
Q20: Figure 10.4 <img src="https://d2lvgg3v3hfg70.cloudfront.net/TB1015/.jpg" alt="Figure 10.4
Q21: Figure 10.6 <img src="https://d2lvgg3v3hfg70.cloudfront.net/TB1015/.jpg" alt="Figure 10.6
Q22: Figure 10.8 <img src="https://d2lvgg3v3hfg70.cloudfront.net/TB1015/.jpg" alt="Figure 10.8
Q24: Table 10.1 <img src="https://d2lvgg3v3hfg70.cloudfront.net/TB1015/.jpg" alt="Table 10.1
Q29: Table 10.1 <img src="https://d2lvgg3v3hfg70.cloudfront.net/TB1015/.jpg" alt="Table 10.1
Q30: Figure 10.17 <img src="https://d2lvgg3v3hfg70.cloudfront.net/TB1015/.jpg" alt="Figure 10.17
Q200: What is the difference between zero accounting
Q219: Suppose that if a local McDonald's restaurant
Q263: For a downward-sloping demand curve, marginal revenue