Multiple Choice
Figure 10.17 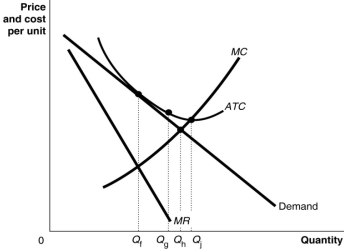
-Refer to Figure 10.17.The allocatively efficient output for the firm represented in the diagram is
A) Qf units
B) Qg units
C) Qh units
D) Qj units
Correct Answer:

Verified
Correct Answer:
Verified
Q25: Figure 10.4 <img src="https://d2lvgg3v3hfg70.cloudfront.net/TB1015/.jpg" alt="Figure 10.4
Q27: When a monopolistically competitive firm cuts its
Q29: Table 10.1 <img src="https://d2lvgg3v3hfg70.cloudfront.net/TB1015/.jpg" alt="Table 10.1
Q32: In the short run, a profit-maximising firm's
Q33: Table 10.3 <img src="https://d2lvgg3v3hfg70.cloudfront.net/TB1015/.jpg" alt="Table 10.3
Q35: Figure 10.9 <img src="https://d2lvgg3v3hfg70.cloudfront.net/TB1015/.jpg" alt="Figure 10.9
Q158: A firm that is first to the
Q200: What is the difference between zero accounting
Q219: Suppose that if a local McDonald's restaurant
Q263: For a downward-sloping demand curve, marginal revenue