Multiple Choice
Figure 10.12 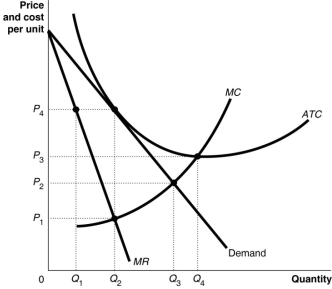
-Refer to Figure 10.12.The productively efficient output for the firm represented in the diagram is
A) Q1 units
B) Q2 units
C) Q3 units
D) Q4 units
Correct Answer:

Verified
Correct Answer:
Verified
Q30: If a monopolistically competitive firm lowers its
Q54: How does the long-run equilibrium of a
Q79: What effect does the entry of new
Q128: Firms use two marketing tools to differentiate
Q141: For the monopolistically competitive firm,<br>A)Price (P)= Marginal
Q141: Table 10.5 <img src="https://d2lvgg3v3hfg70.cloudfront.net/TB1015/.jpg" alt="Table 10.5
Q144: Figure 10.7 <img src="https://d2lvgg3v3hfg70.cloudfront.net/TB1015/.jpg" alt="Figure 10.7
Q145: Figure 10.15 <img src="https://d2lvgg3v3hfg70.cloudfront.net/TB1015/.jpg" alt="Figure 10.15
Q150: What is a major difference between monopolistic
Q215: For a monopolistically competitive firm, price equals