Multiple Choice
Figure 10.15 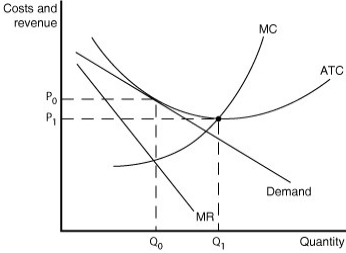 Figure 10.15 illustrates a monopolistically competitive firm.
-Refer to Figure 10.15.Which of the following statements describes the firm depicted in the diagram?
A) The firm is making no economic profit and will exit the industry.
B) The firm is suffering an economic loss by producing at Q0 but will break even it increases its output to Q1.
C) The firm achieves productive efficiency by producing at Q0.
D) The firm is in long-run equilibrium and is breaking even.
Correct Answer:

Verified
Correct Answer:
Verified
Q30: If a monopolistically competitive firm lowers its
Q79: What effect does the entry of new
Q128: Firms use two marketing tools to differentiate
Q140: How is long-run equilibrium under monopolistic competition
Q141: For the monopolistically competitive firm,<br>A)Price (P)= Marginal
Q141: Table 10.5 <img src="https://d2lvgg3v3hfg70.cloudfront.net/TB1015/.jpg" alt="Table 10.5
Q144: Figure 10.7 <img src="https://d2lvgg3v3hfg70.cloudfront.net/TB1015/.jpg" alt="Figure 10.7
Q146: Figure 10.12 <img src="https://d2lvgg3v3hfg70.cloudfront.net/TB1015/.jpg" alt="Figure 10.12
Q150: What is a major difference between monopolistic
Q215: For a monopolistically competitive firm, price equals