Multiple Choice
Figure 16.5 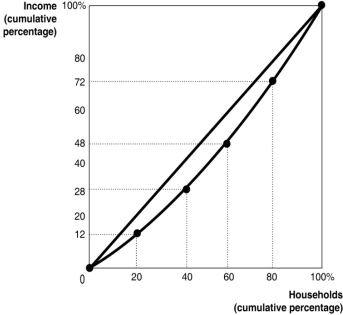 Figure 16.5 shows the Lorenz curve for a hypothetical country.
-Refer to Figure 16.5.The highest 40 per cent of households
A) earn 24 per cent of the society's total income.
B) earn 28 per cent of the society's total income.
C) earn 48 per cent of the society's total income.
D) earn 72 per cent of the society's total income.
Correct Answer:

Verified
Correct Answer:
Verified
Q31: For a given supply curve, the deadweight
Q51: What is a Lorenz curve and what
Q108: Figure 16.1 <img src="https://d2lvgg3v3hfg70.cloudfront.net/TB1015/.jpg" alt="Figure 16.1
Q111: A Lorezo curve illustrates<br>A)a comparison of the
Q114: Figure 16.6 <img src="https://d2lvgg3v3hfg70.cloudfront.net/TB1015/.jpg" alt="Figure 16.6
Q115: If you pay $3000 in taxes on
Q116: A Lorenz curve summarises the information provided
Q148: Consider a public good such as fire
Q151: All Gini coefficients must lie between 0
Q234: According to the ability-to-pay principle of taxation<br>A)individuals