Multiple Choice
Figure 16.6 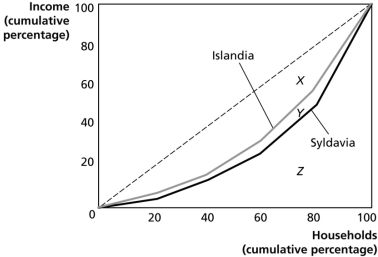 Figure 16.6 shows the Lorenz curves for Islandia and Syldavia.
-Refer to Figure 16.6.If area X = 2060, area Y = 240, and area Z = 2700, calculate the Gini coefficient for Islandia.
A) 0) 41
B) 0) 45
C) 0) 70
D) 0) 76
Correct Answer:

Verified
Correct Answer:
Verified
Q31: For a given supply curve, the deadweight
Q51: What is a Lorenz curve and what
Q111: A Lorezo curve illustrates<br>A)a comparison of the
Q113: Figure 16.5 <img src="https://d2lvgg3v3hfg70.cloudfront.net/TB1015/.jpg" alt="Figure 16.5
Q114: If your income is $40,000 and you
Q115: If you pay $3000 in taxes on
Q116: A Lorenz curve summarises the information provided
Q148: Consider a public good such as fire
Q151: All Gini coefficients must lie between 0
Q234: According to the ability-to-pay principle of taxation<br>A)individuals