Multiple Choice
Exhibit 21-7 Use the cost-volume-profit graph below to answer the following question(s) .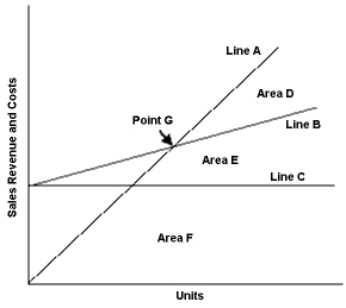
-Refer to Exhibit 21-7. Point G on the cost-volume-profit graph represents the:
A) Target profit sales level
B) Loss area sales level
C) Break-even sales level
D) After-tax profit sales level
Correct Answer:

Verified
Correct Answer:
Verified
Q24: Exhibit 21-7 Use the cost-volume-profit graph below
Q25: The following information is given for Kooskia
Q26: Winslow Company sold 10,000 swing sets this
Q27: Exhibit 21-7 Use the cost-volume-profit graph below
Q28: Which of the following is NOT a
Q30: Exhibit 21-9 Stella Signs sells two different
Q31: Grate Company's product has a selling price
Q32: Mosely Company's per-unit cost is the same
Q33: A company that has a per-unit contribution
Q34: The contribution margin minus total fixed costs