Multiple Choice
Exhibit 21-8 Use the profit graph below to answer the following question(s) .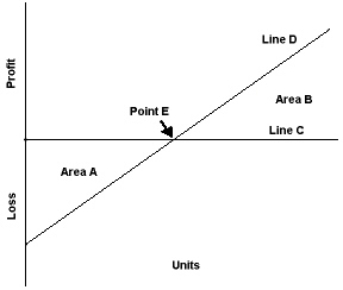
-Refer to Exhibit 21-8. Point E on the profit graph represents the:
A) Profit area
B) Total costs
C) Loss area
D) Break-even point
Correct Answer:

Verified
Correct Answer:
Verified
Related Questions
Q16: Which of the following is most likely
Q17: All the following are common cost behavior
Q18: Exhibit 21-5 The following is a partial
Q19: Slaby Motors sells two different products. Following
Q20: Using the following information for Palmer Company,
Q22: If total sales are $460,000, total variable
Q23: Refer to the figure below. A charge
Q24: Exhibit 21-7 Use the cost-volume-profit graph below
Q25: The following information is given for Kooskia
Q26: Winslow Company sold 10,000 swing sets this