Essay
Using the following information for Palmer Company, analyze the cost behavior between the total costs and units produced for the six-month period. Use the high-low method to identify the variable cost rate and the fixed cost portion of total costs.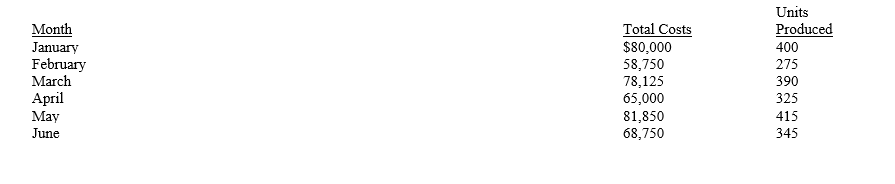
Correct Answer:

Verified
Correct Answer:
Verified
Q15: Exhibit 21-7 Use the cost-volume-profit graph below
Q16: Which of the following is most likely
Q17: All the following are common cost behavior
Q18: Exhibit 21-5 The following is a partial
Q19: Slaby Motors sells two different products. Following
Q21: Exhibit 21-8 Use the profit graph below
Q22: If total sales are $460,000, total variable
Q23: Refer to the figure below. A charge
Q24: Exhibit 21-7 Use the cost-volume-profit graph below
Q25: The following information is given for Kooskia