Multiple Choice
 According to the graph shown,producer surplus is:
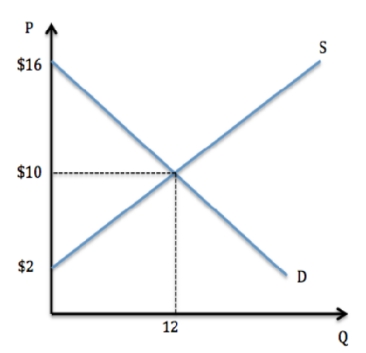
A) the area under the demand curve and above the market price.
B) the area under the supply curve and above the price.
C) the area above the supply curve and below the price.
D) the area above the demand curve and below the price.
Correct Answer:

Verified
Correct Answer:
Verified
Q35: <img src="https://d2lvgg3v3hfg70.cloudfront.net/TB1248/.jpg" alt=" According to the
Q36: Assume there are three hardware stores,each willing
Q37: <img src="https://d2lvgg3v3hfg70.cloudfront.net/TB1248/.jpg" alt=" Assume the market
Q38: Surplus refers to:<br>A) a way of measuring
Q39: Assume there are three hardware stores,each willing
Q41: What is the producer surplus earned by
Q42: A market has four individuals,each considering buying
Q43: Markets can be missing if:<br>A) there is
Q45: Deadweight loss:<br>A) occurs when the market price
Q115: Deadweight loss:<br>A) occurs in markets that are