Multiple Choice
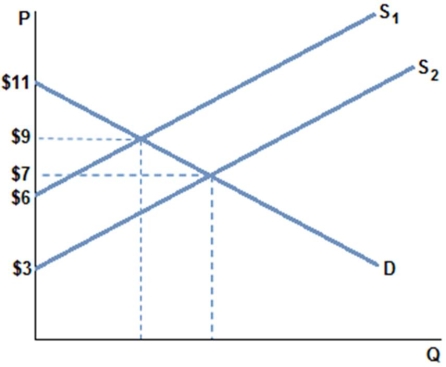 Assume the market is in equilibrium in the graph shown at demand D and supply S1 (at a quantity of 5) .If the supply curve shifts to S2,and a new equilibrium is reached (at a quantity of 7) ,which of the following is true?
A) Total surplus increases by $12.50.
B) Total surplus decreases by $12.50.
C) Total surplus increases by $15.50.
D) Total surplus decreases by $15.50.
Correct Answer:

Verified
Correct Answer:
Verified
Q32: <img src="https://d2lvgg3v3hfg70.cloudfront.net/TB1248/.jpg" alt=" According to the
Q33: <img src="https://d2lvgg3v3hfg70.cloudfront.net/TB1248/.jpg" alt=" Assume the market
Q34: Assume a market that has an equilibrium
Q35: <img src="https://d2lvgg3v3hfg70.cloudfront.net/TB1248/.jpg" alt=" According to the
Q36: Assume there are three hardware stores,each willing
Q38: Surplus refers to:<br>A) a way of measuring
Q39: Assume there are three hardware stores,each willing
Q40: <img src="https://d2lvgg3v3hfg70.cloudfront.net/TB1248/.jpg" alt=" According to the
Q41: What is the producer surplus earned by
Q42: A market has four individuals,each considering buying