Multiple Choice
Refer to Figure 5.1.In which graph does a shift from BL1 to BL2 represent an increase in the price of DVDs? 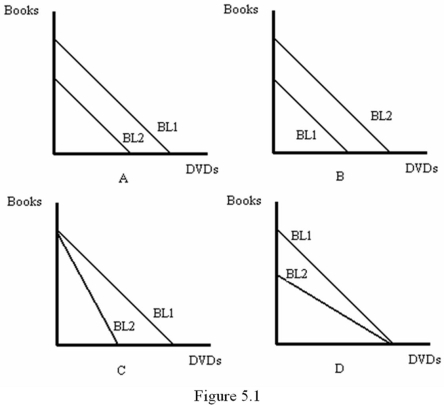
A) A
B) B
C) C
D) D
Correct Answer:

Verified
Correct Answer:
Verified
Related Questions
Q14: Which of the following conditions must hold
Q15: Mike's income is $600 per month.He spends
Q16: In the United States,some state governments set
Q17: An increase in the price of the
Q18: Suppose a consumer buy books and DVDs.The
Q20: A utility function is a mathematical function
Q21: When the price elasticity of demand is
Q22: If the income-consumption path slopes down,then:<br>A) both
Q23: If two goods are substitutes,then an increase
Q24: Refer to Figure 5.6.Which diagram shows an