Multiple Choice
Refer to Figure 5.6.Which diagram shows an increase in income with both bread and soup being normal goods? 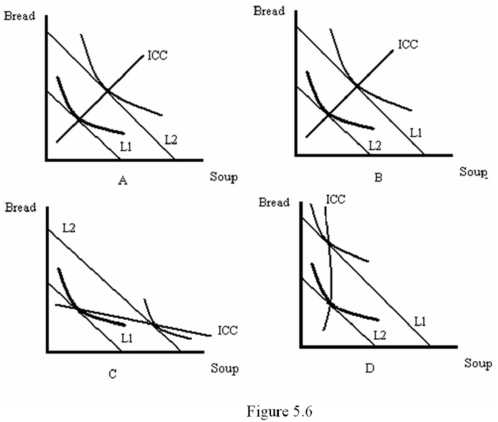
A) A
B) B
C) C
D) D
Correct Answer:

Verified
Correct Answer:
Verified
Related Questions
Q19: Refer to Figure 5.1.In which graph does
Q20: A utility function is a mathematical function
Q21: When the price elasticity of demand is
Q22: If the income-consumption path slopes down,then:<br>A) both
Q23: If two goods are substitutes,then an increase
Q25: Suppose that steak is a normal good
Q26: When the price elasticity of demand is
Q27: If a change in the price of
Q28: An increase in the price of the
Q29: At a boundary choice:<br>A) the consumer purchases