Multiple Choice
Refer to Figure 5.5.Which diagram shows the price-consumption curve resulting from a decrease in the price of good X? 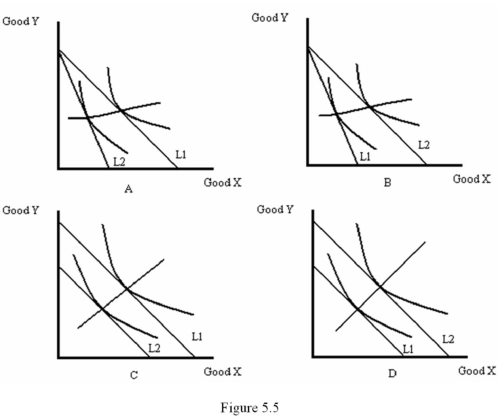
A) A
B) B
C) C
D) D
Correct Answer:

Verified
Correct Answer:
Verified
Related Questions
Q57: A curve that describes the relationship between
Q58: Boundary solutions arise when:<br>A) a good provides
Q59: Refer to Figure 5.5.Which diagram shows the
Q60: When the consumer has found the best
Q61: Which of the following is NOT given
Q63: Refer to Figure 5.6.Which diagram shows a
Q64: Which of the following statements is true?<br>A)
Q65: Suppose a consumer buys pizza (P)and soft
Q66: Refer to Table 5.1,which shows Madeline's preference
Q67: Refer to Figure 5.7.Which diagram best represents