Multiple Choice
Refer to Figure 5.5.Which diagram shows the income-consumption curve resulting from a decrease in income? 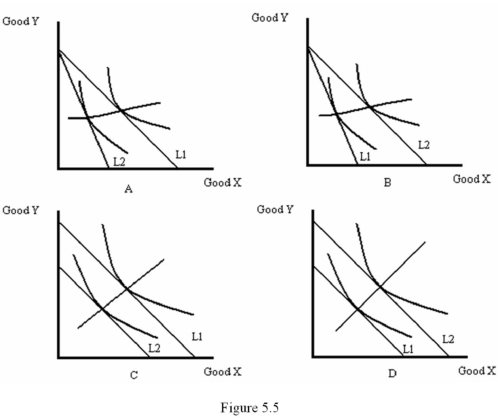
A) A
B) B
C) C
D) D
Correct Answer:

Verified
Correct Answer:
Verified
Related Questions
Q54: When indifference curves have _ marginal rates
Q55: If the price of the good measured
Q56: Which of the following goods is given
Q57: A curve that describes the relationship between
Q58: Boundary solutions arise when:<br>A) a good provides
Q60: When the consumer has found the best
Q61: Which of the following is NOT given
Q62: Refer to Figure 5.5.Which diagram shows the
Q63: Refer to Figure 5.6.Which diagram shows a
Q64: Which of the following statements is true?<br>A)