Essay
Six Sigma is one approach for setting quality expectations for a given process or output. As pointed out in Chapter 17 of your text, the term "Six Sigma" comes from statistics: in a normal distribution, the area (probability) outside of +/− six (6) standard deviations from the mean value is exceedingly small. You are provided the following values from a standardized normal distribution (i.e., a distribution with a mean of zero and a standard deviation of 1.0): Note: The Z values in the above table refer to the number of sigmas to the right of center (i.e., to the right of Z = 0). The listed probabilities, p, refer to the area to the right of the chosen Z point, as illustrated by the graph below: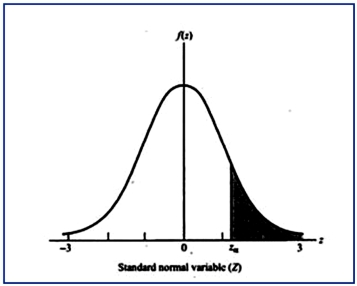 Required:
1. Given the above, what is the total probability (area under the curve) corresponding to Z = 0 +/− 1.0 sigma, rounded to two decimal places (e.g., 0.34817 = 34.82%)? How many units (out of 1,000 outputs) would have one or more defects for a process operating at one-sigma performance level? Round your answer to nearest whole number.
2. What is the total probability (area under the curve) corresponding to Z = 0 +/− 3.0 sigma, rounded to two decimal places? How many units (out of 1,000 outputs) would have one or more defects for a process operating at three-sigma performance level? Round your answer to nearest whole number.
3. Under a four-sigma control level, what is the total area in the two tails of the distribution, rounded to six (6) decimal places (e.g., 0.00004169 = 0.00417%). What is the total probability (area under the curve) corresponding to Z = 0 +/− 4.0 sigma, rounded to two decimal places? How many units (out of 100,000 outputs) would have one or more defects for a process operating at four-sigma performance level? Round your answer to nearest whole number.
4. What general conclusion can you draw based on the preceding results?
Correct Answer:

Verified
1. Area under the curve = 1.0 − (0.1587 ...View Answer
Unlock this answer now
Get Access to more Verified Answers free of charge
Correct Answer:
Verified
View Answer
Unlock this answer now
Get Access to more Verified Answers free of charge
Q135: Which of the following would not be
Q136: Pandra Manufacturing specifies the quality characteristic of
Q137: Which of the following items is not
Q138: The Bulldog Company incurred the following
Q139: List and explain three tools that can
Q141: The desired target quality characteristic of a
Q142: Which of the following approaches to cost-system
Q143: The term performance quality refers to:<br>A) The
Q144: Which of the following statements about product
Q145: The cost of conformance in a Cost-of-Quality