Multiple Choice
Figure 21-3
In each case, the budget constraint moves from BC-1 to BC-2. 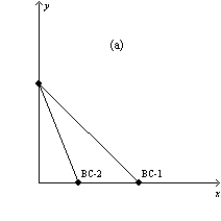
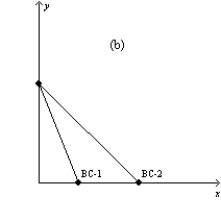
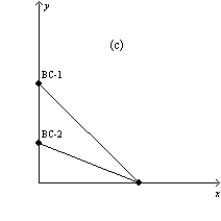
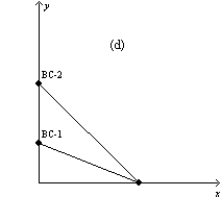
-Refer to Figure 21-3. Which of the graphs in the figure could reflect a simultaneous decrease in the prices of both goods?
(i) graph a
(ii) graph b
(iii) graph c
(iv) graph d
A) (i) only
B) (iv) only
C) (ii) or (iii) only
D) None of the above is correct.
Correct Answer:

Verified
Correct Answer:
Verified
Q60: The theory of consumer choice provides the
Q103: If income increases and prices are unchanged,
Q165: Because people are more willing to trade
Q260: Figure 21-6 <img src="https://d2lvgg3v3hfg70.cloudfront.net/TB1273/.jpg" alt="Figure 21-6
Q324: Janet prefers cashews to almonds. She prefers
Q455: Figure 21-25 The figure pertains to a
Q499: Figure 21-14 <img src="https://d2lvgg3v3hfg70.cloudfront.net/TB1273/.jpg" alt="Figure 21-14
Q538: If Suzette responds to an increase in
Q538: A consumer likes two goods: hamburgers and
Q548: Figure 21-19 <img src="https://d2lvgg3v3hfg70.cloudfront.net/TB1273/.jpg" alt="Figure 21-19