Short Answer
Figure 21-30 The graph shows two budget constraints for a consumer. 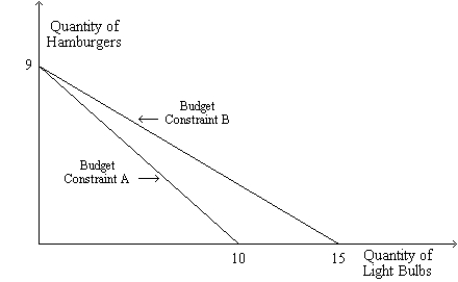
-Refer to Figure 21-30. Suppose the consumer's income is $90 and Budget Constraint A applies. What is the price of a light bulb?
Correct Answer:

Verified
The price ...View Answer
Unlock this answer now
Get Access to more Verified Answers free of charge
Correct Answer:
Verified
View Answer
Unlock this answer now
Get Access to more Verified Answers free of charge
Q93: When the price of a normal good
Q97: Figure 21-32 The figure shows three indifference
Q98: Figure 21-24 The figure shows three indifference
Q99: Traci consumes two goods, lemonade and pretzels.
Q100: Which of the following is an example
Q103: If income increases and prices are unchanged,
Q105: A family on a trip budgets $1,000
Q106: An optimizing consumer will select the consumption
Q194: A decrease in the price of the
Q198: If goods A and B are perfect