Short Answer
The table below shows the sales for a plastics manufacturer recorded over the past year. The seasonal indexes for each quarter are also provided. To track the trend for these four quarters, use the indexes to deseasonalize the sales data 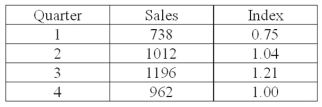 What is the deseasonalized sales value for quarter 1?
Correct Answer:

Verified
Correct Answer:
Verified
Q11: The Durbin-Watson statistic is based on the
Q25: What is the correct order of events
Q37: What type of analysis predicts the future
Q39: For a straight trend line, what represents
Q42: In a time series, economic periods of
Q45: A resort hotel performed a quarterly time
Q45: The Durbin-Watson statistic is used to test
Q53: The forecast for the third quarter is
Q63: The forecast for the third quarter is
Q122: Given a linear time series trend Ŷ