Short Answer
A resort hotel performed a quarterly time series analysis for demands over the last five years (periods 1 through 20). The analysis resulted in the following trend equation and seasonal indexes:
Ŷ = 1000 + 150t 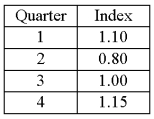 Based on the seasonal indexes, which quarter is expected to have 15% more demand than predicted by the trend line?
Correct Answer:

Verified
Correct Answer:
Verified
Q25: What is the correct order of events
Q32: What is the logarithmic transformation for the
Q35: A graph of a deseasonalized time series
Q41: The table below shows the sales for
Q42: In a time series, economic periods of
Q45: The Durbin-Watson statistic is used to test
Q48: The Durbin-Watson statistic is used to analyze<br>A)
Q49: Product sales since 1999 are: <img src="https://d2lvgg3v3hfg70.cloudfront.net/TB2538/.jpg"
Q53: The forecast for the third quarter is
Q63: The forecast for the third quarter is