Short Answer
A resort hotel performed a quarterly time series analysis for demands over the last five years (periods 1 through 20). The analysis resulted in the following trend equation and seasonal indexes:
Ŷ = 1000 + 150t 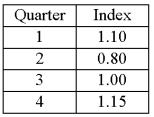 Based on the seasonal indexes, which quarter is expect to have 20% less demand than predicted by the trend line?
Correct Answer:

Verified
Correct Answer:
Verified
Q52: If the time series trend is nonlinear,a
Q89: If the exports (in $millions) for the
Q96: The moving average method smoothes out the
Q103: For a time series beginning with 1991
Q120: If time series data are plotted on
Q122: What method is most commonly used to
Q125: If we eliminate trend, cyclical and irregular
Q126: How does data that increases by equal
Q127: To calculate quarterly typical seasonal indexes, how
Q128: To calculate monthly typical seasonal indexes, after