Multiple Choice
A random sample of 40 companies with assets over $10 million was selected and asked for their annual computer technology expense and industry. The ANOVA comparing the average computer technology expense among three industries rejected the null hypothesis. The Mean Square Error (MSE) was 195. The following table summarized the results: 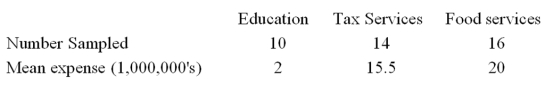 Based on the comparison between the mean annual computer technology expense for companies in the Tax Service and Food Service industries, the 95% confidence interval shows an interval of -14.85 to 5.85 for the difference. This result indicates that
A) There is no significant difference between the two expenses.
B) The interval contains a difference of 20.7.
C) Companies in the Tax Service industry spend significantly less than companies in the Food Service industry.
D) Companies in the Food Service industry spend significantly less than companies in the Tax Service industry.
Correct Answer:

Verified
Correct Answer:
Verified
Q23: The F-distribution's curve is positively skewed.
Q118: A bottle cap manufacturer with four machines
Q119: A manufacturer of automobile transmissions uses two
Q120: Suppose that an automobile manufacturer designed a
Q121: A company compared the variance of salaries
Q122: Given the following Analysis of Variance table
Q124: The college of business was interested in
Q125: Given the following Analysis of Variance table
Q126: A company compared the variance of salaries
Q127: When H<sub>0</sub> is rejected in ANOVA, _