Multiple Choice
In the following graph, 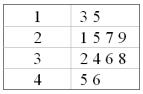
A) The median is 2.5.
B) The minimum value is 135.
C) The maximum value is 456.
D) The range is 33.
Correct Answer:

Verified
Correct Answer:
Verified
Related Questions
Q20: The following stem-and-leaf display reports the number
Q25: What is the common purpose of a
Q28: What statistics are needed to draw a
Q73: What is the common purpose of a
Q99: The following graph is a <img src="https://d2lvgg3v3hfg70.cloudfront.net/TB2538/.jpg"
Q100: The lengths of stay on the cancer
Q102: A telemarketing firm is monitoring the performance
Q103: For the following data, what is the
Q107: The following graph is <img src="https://d2lvgg3v3hfg70.cloudfront.net/TB2538/.jpg" alt="The
Q108: Given the sample information in the following