Multiple Choice
The following graph is a 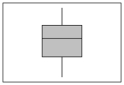
A) Dot plot
B) Stem-and-leaf display
C) Box plot
D) Contingency table
Correct Answer:

Verified
Correct Answer:
Verified
Related Questions
Q20: The following stem-and-leaf display reports the number
Q73: What is the common purpose of a
Q94: A sample of the homes currently offered
Q95: For the following data, find the information
Q96: What is the best way to display
Q97: Given the sample information in the following
Q100: The lengths of stay on the cancer
Q102: A telemarketing firm is monitoring the performance
Q103: For the following data, what is the
Q104: In the following graph, <img src="https://d2lvgg3v3hfg70.cloudfront.net/TB2538/.jpg" alt="In